Data Visualization
Data Visualization
Data Visualization
Relationship Corruption and Happiness
Relationship Corruption and Happiness
Overview
Corruption and happiness are interconnected aspects in the populations of various countries. Each country has its own unique traditions and governmental approaches to serving its people. However, it's important to consider how corruption—even at low levels—can impact a nation's performance, particularly in terms of its citizens' happiness.
Corruption and happiness are interconnected aspects in the populations of various countries. Each country has its own unique traditions and governmental approaches to serving its people. However, it's important to consider how corruption—even at low levels—can impact a nation's performance, particularly in terms of its citizens' happiness.
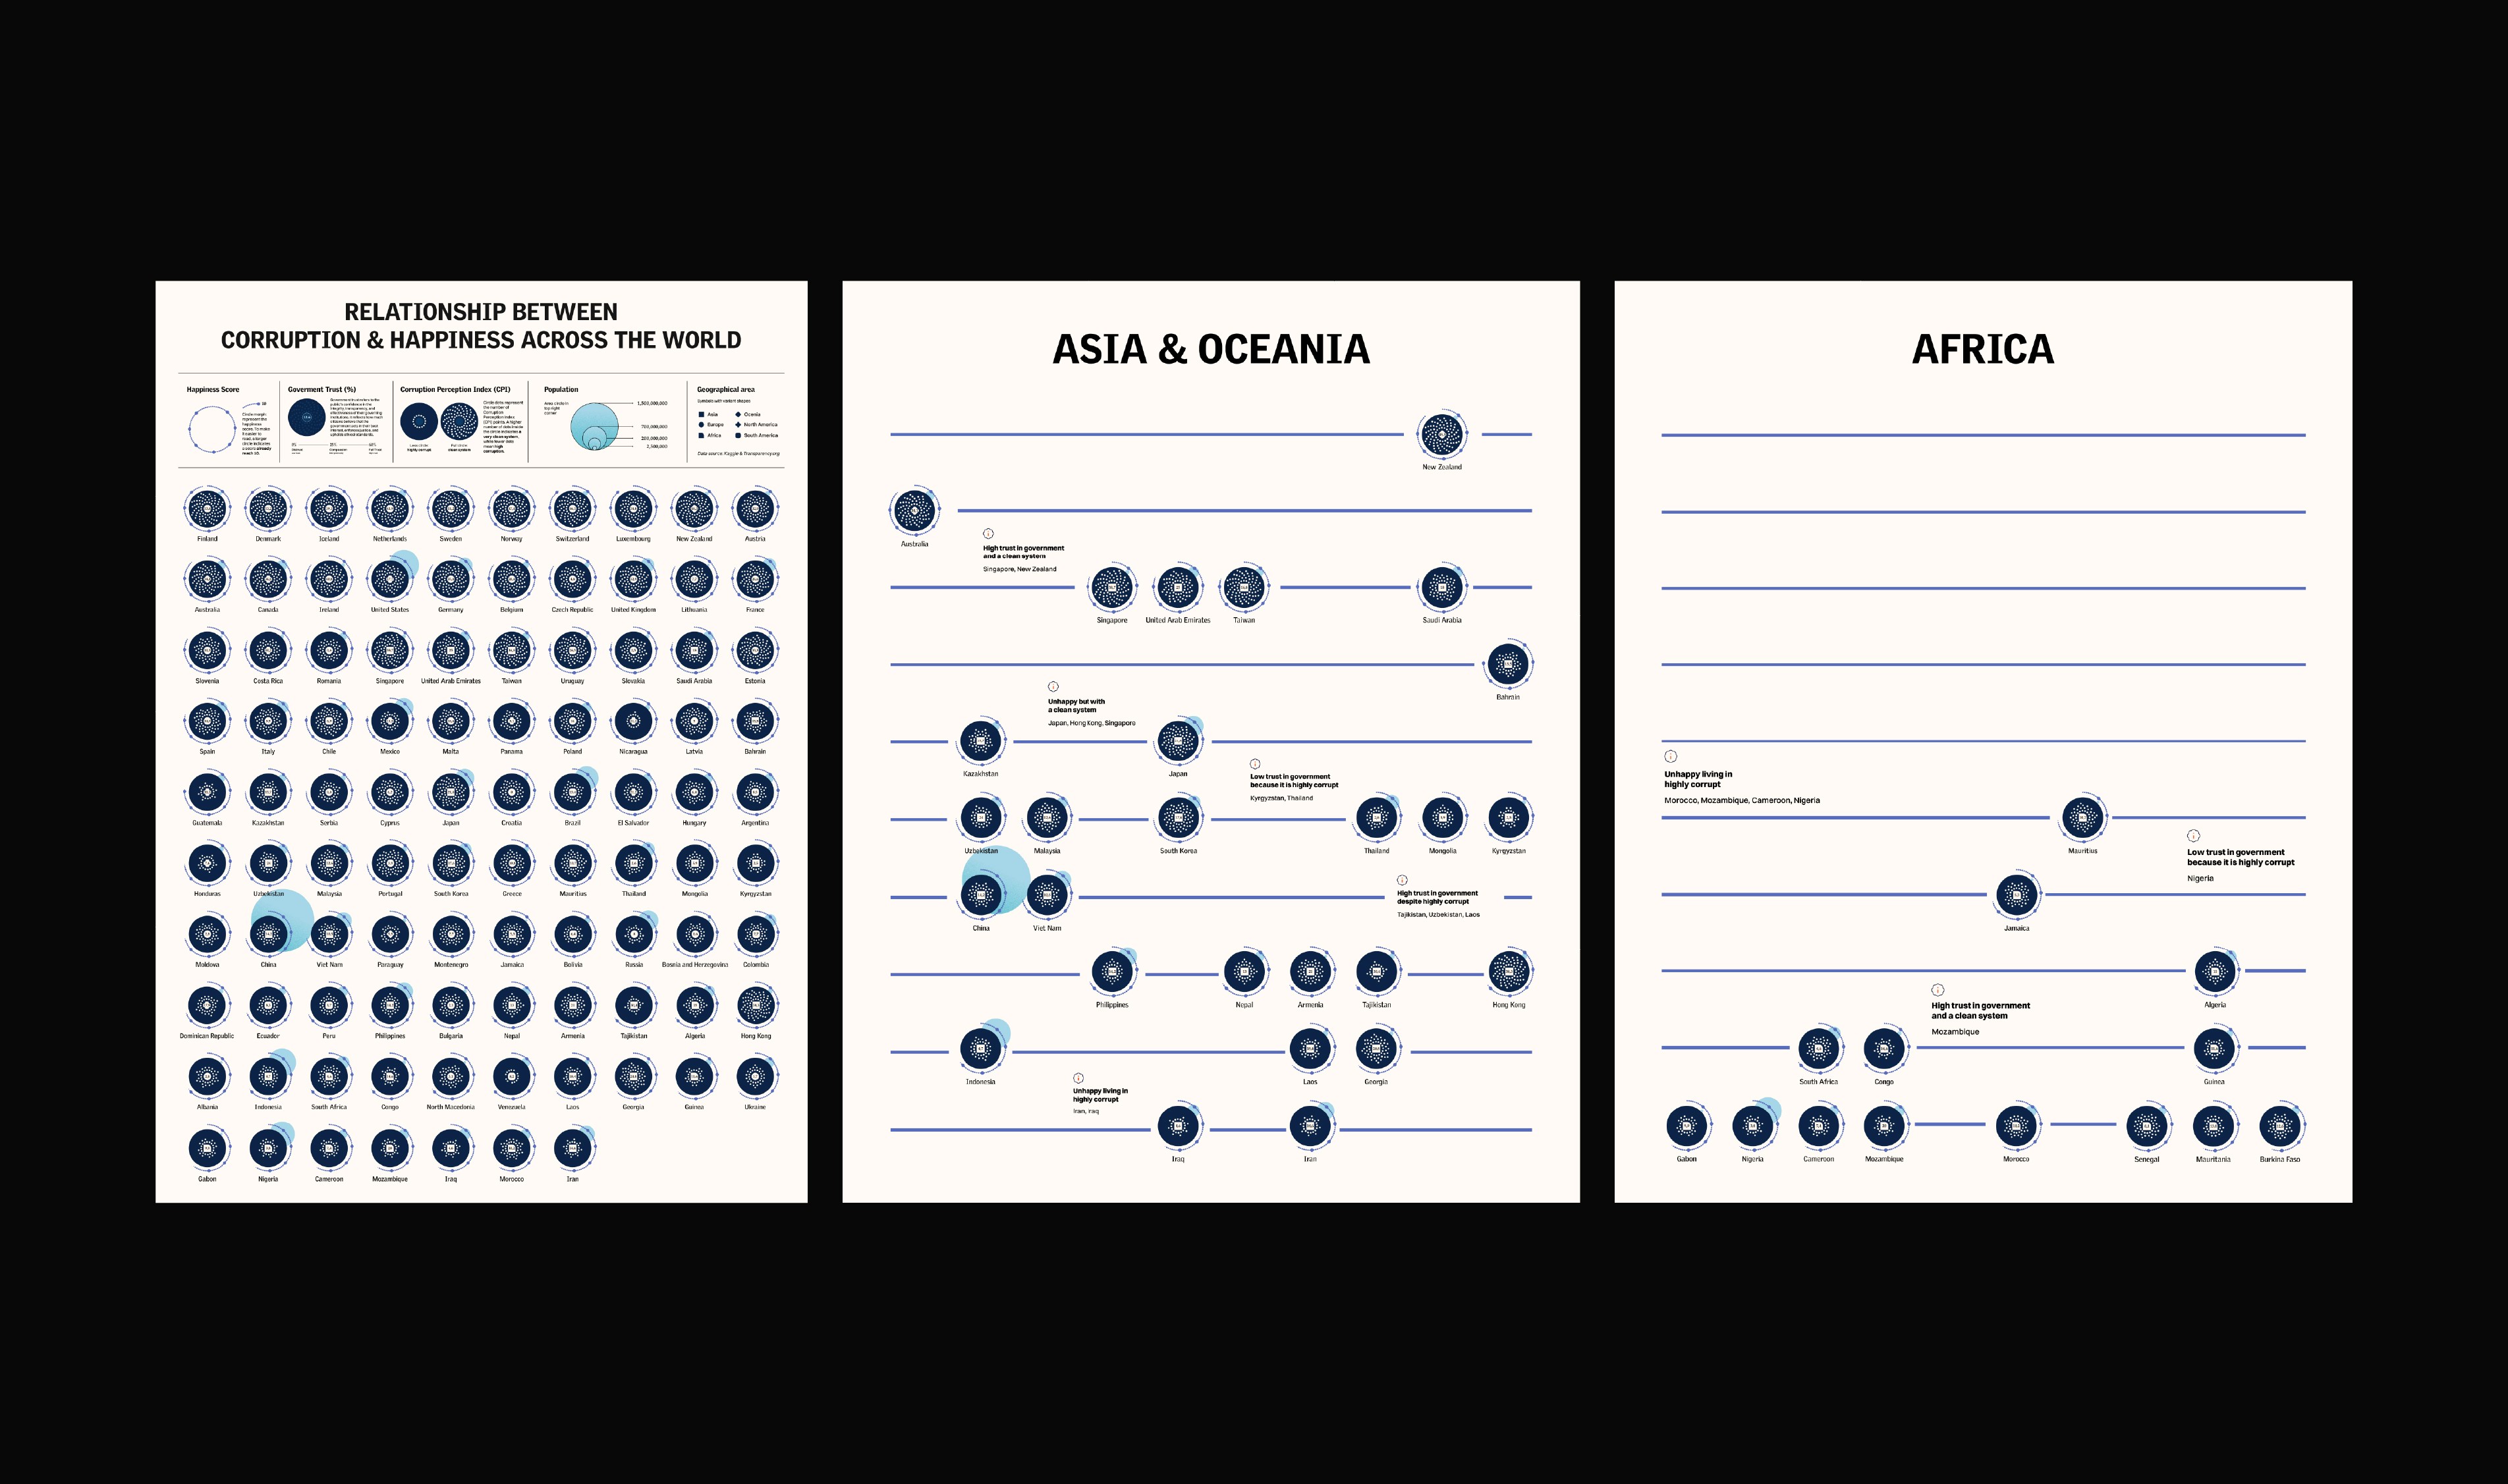
We can observe that some small countries with clean governments tend to report higher levels of happiness. On the other hand, in countries with large populations, corruption often acts like a virus, eroding the spirit of the people and ultimately diminishing their happiness.
We can observe that some small countries with clean governments tend to report higher levels of happiness. On the other hand, in countries with large populations, corruption often acts like a virus, eroding the spirit of the people and ultimately diminishing their happiness.

Based on the direction, we begin the exploration by evaluating and reviewing all the necessary data. The data can be extensive, covering variations in generosity, trust in government, and even CPI status. However, it should be connected into one coherent flow to understand how corruption in a country affects happiness — or whether happiness still exists even when a country ranks well on the corruption index.
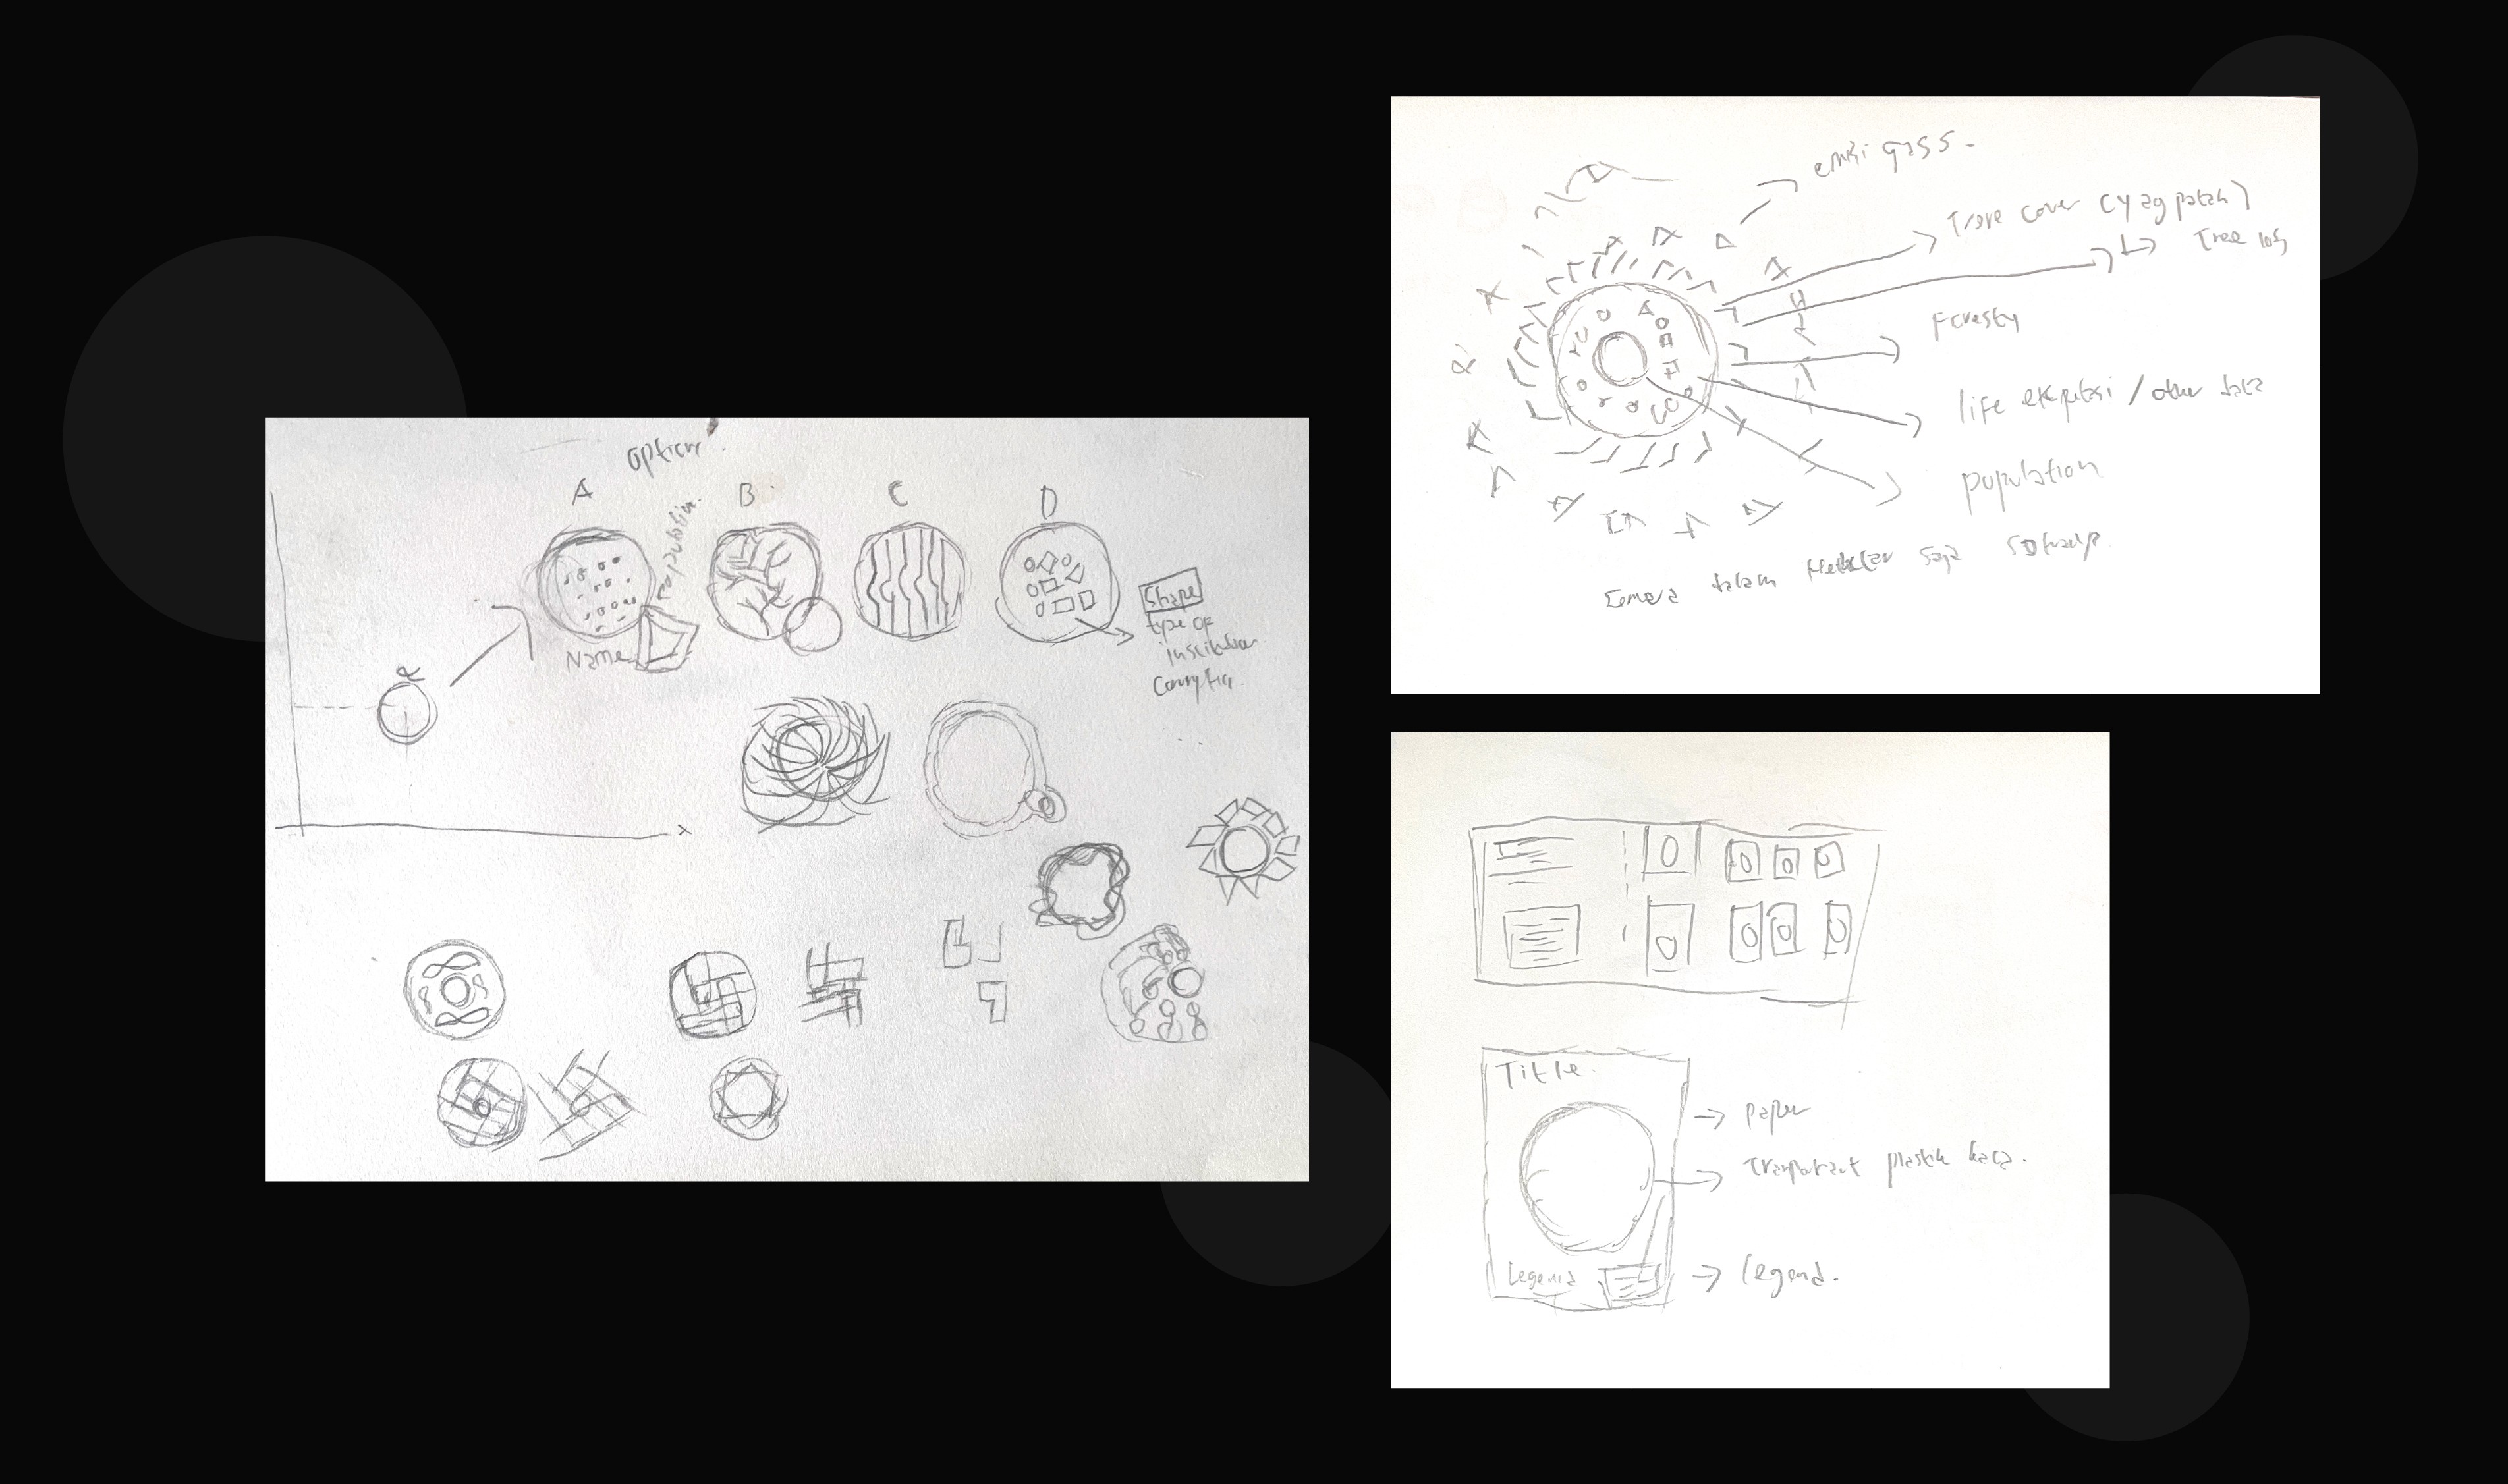
We then continue with the sketch phase to visualize how the concept will be revealed. We decided to use a large circle with many smaller dots, symbolizing corruption spreading like a virus within the main circle, which also serves as a visual guide.
Corruption and happiness are interconnected aspects in the populations of various countries. Each country has its own unique traditions and governmental approaches to serving its people. However, it's important to consider how corruption—even at low levels—can impact a nation's performance, particularly in terms of its citizens' happiness.
We can observe that some small countries with clean governments tend to report higher levels of happiness. On the other hand, in countries with large populations, corruption often acts like a virus, eroding the spirit of the people and ultimately diminishing their happiness.
The data visualization shows an extensive range using a conservative method, specifically an X–Y graph. Based on this, we can identify countries with very low, moderate, and high levels of corruption.

We explored many design directions because we wanted this design not only to present accurate data and relationships, but also to create an emotional experience for the audience. We want users to feel something when they read and view it. The circle is not just a shape, but a message, and the guiding dots become visual elements that can be intuitively felt as part of the design guidance.
The data visualization shows an extensive range using a conservative method, specifically an X–Y graph. Based on this, we can identify countries with very low, moderate, and high levels of corruption.
We explored many design directions because we wanted this design not only to present accurate data and relationships, but also to create an emotional experience for the audience. We want users to feel something when they read and view it. The circle is not just a shape, but a message, and the guiding dots become visual elements that can be intuitively felt as part of the design guidance.

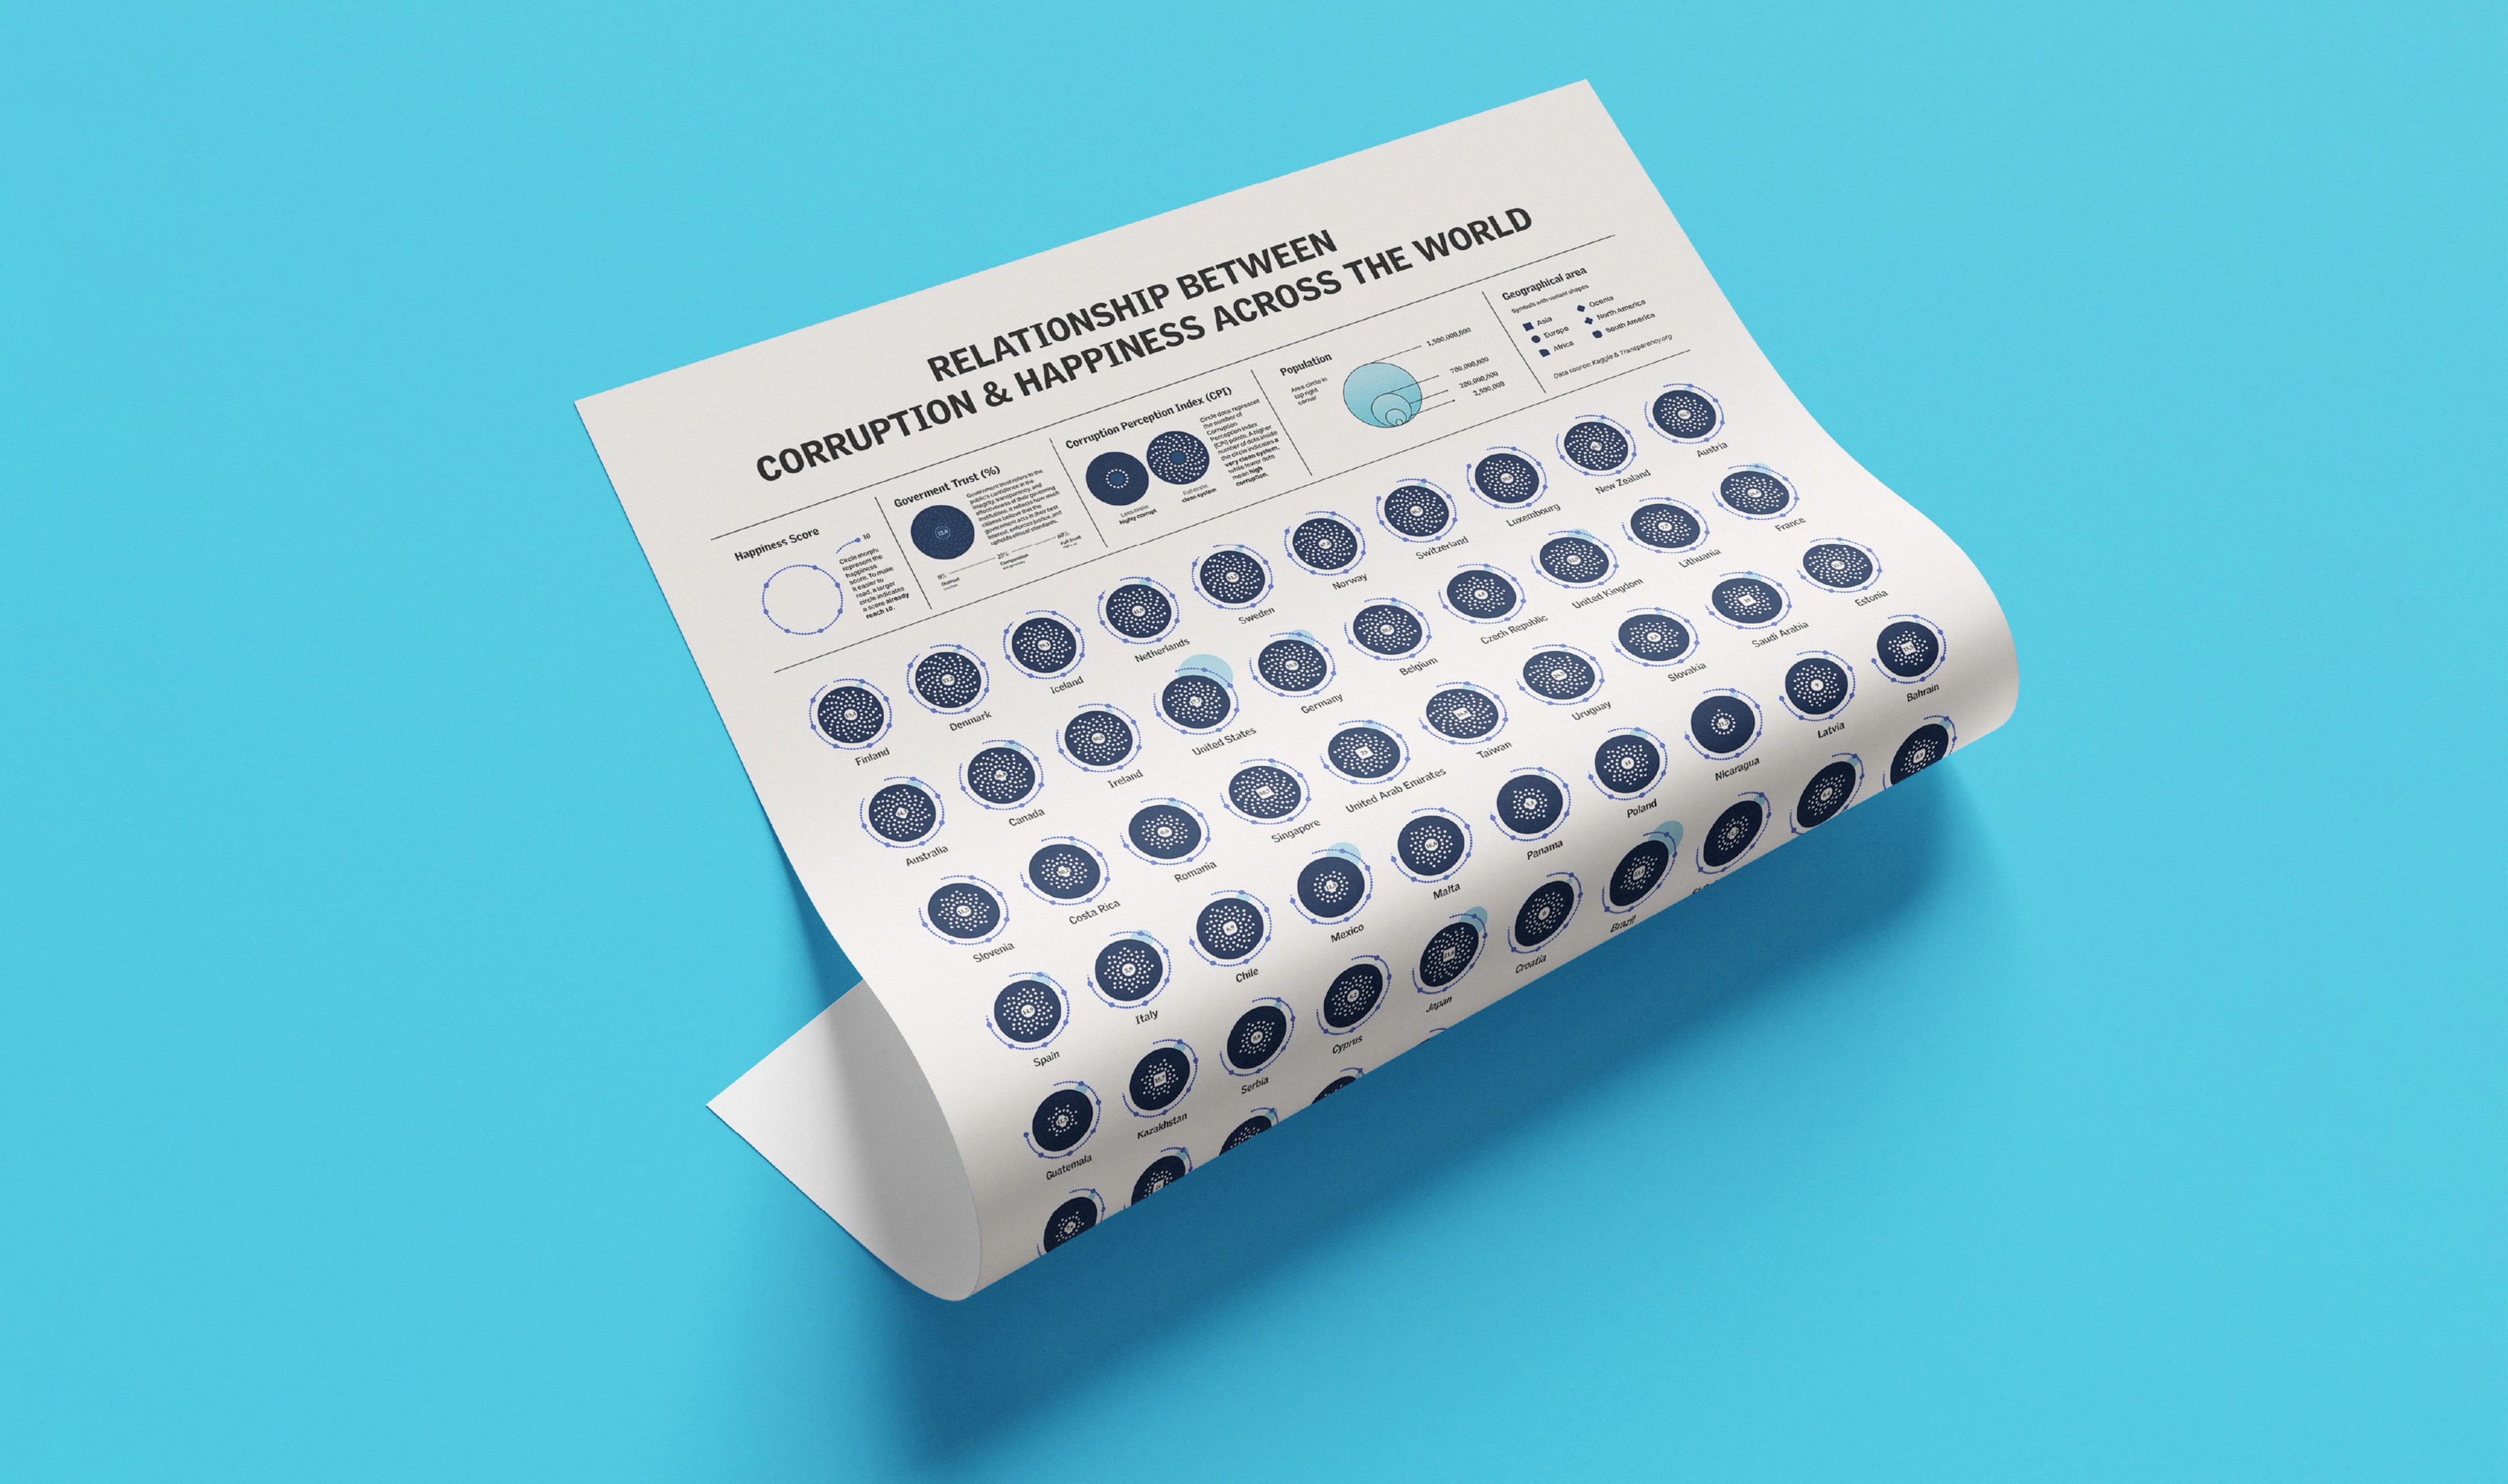
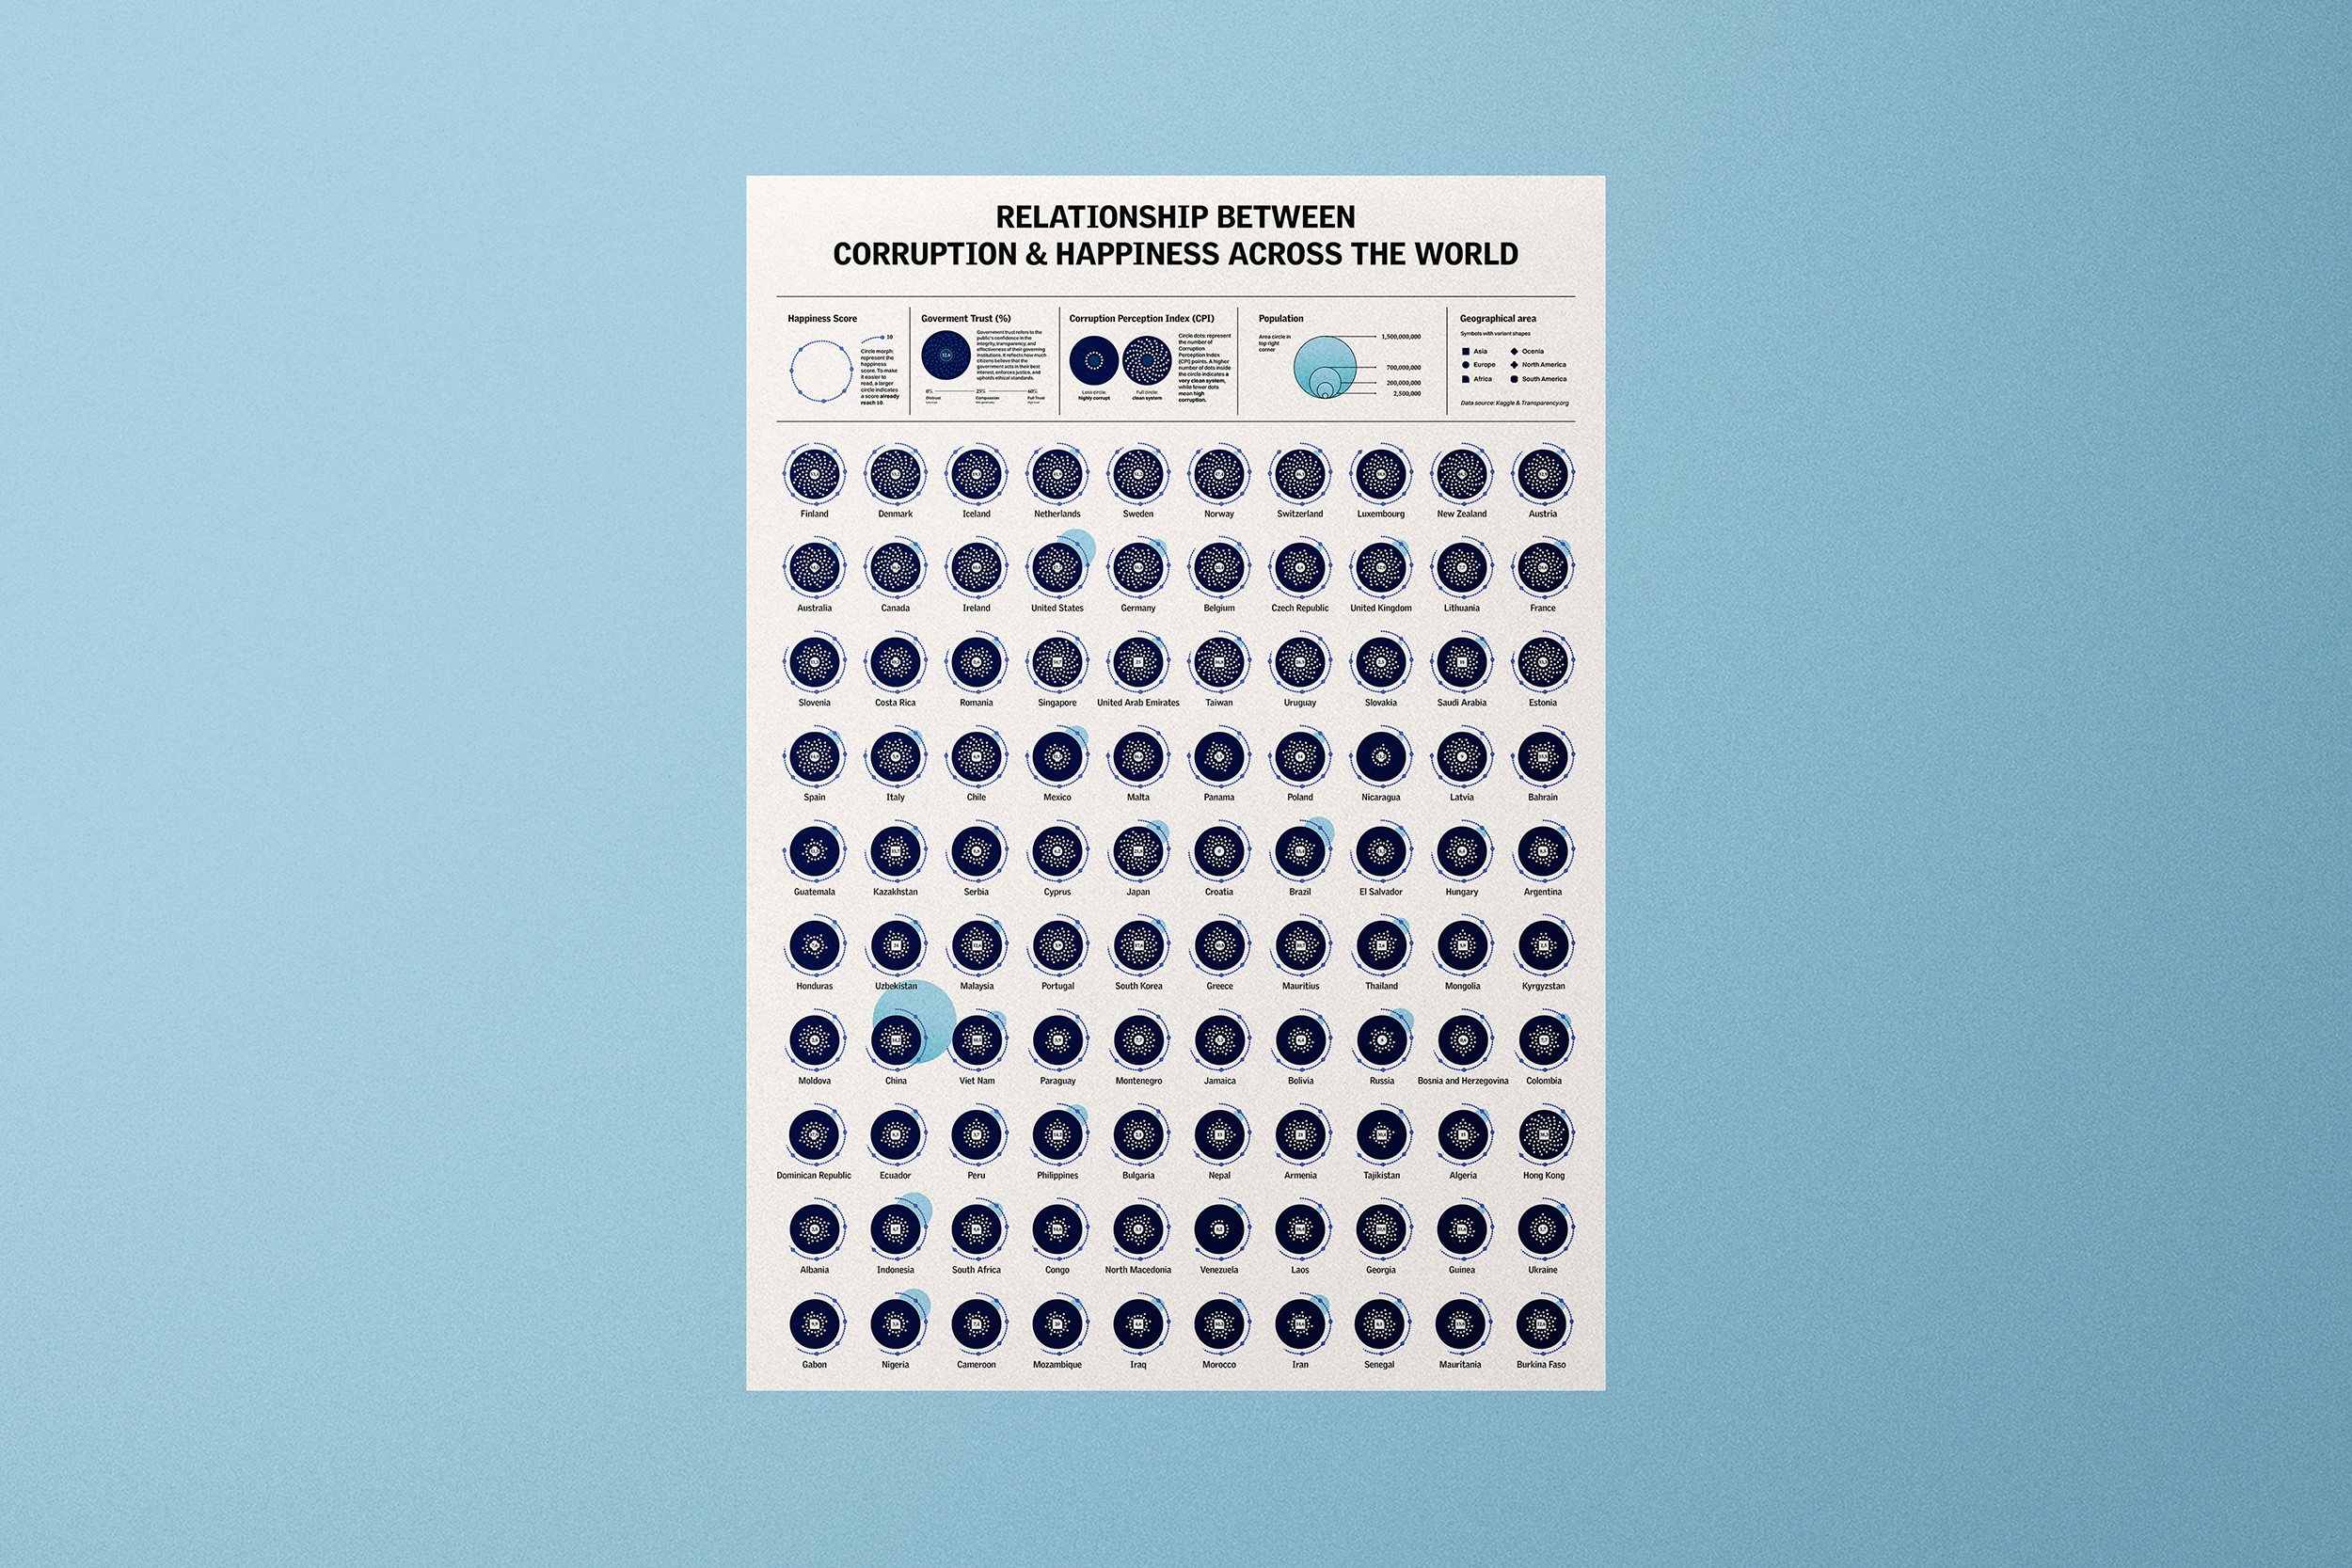
Lastly, here is the final design. We use white as the background color to create a clean look and improve readability. This design can be used in various settings—indoor, outdoor, digital, or for printed materials such as pamphlets.
In this data visualization, Afternorth represents this concept using circular forms. The emptiness within the main circle symbolizes how corruption has eaten away at the core of a country. The outline stroke surrounding the circle represents the presence of guidance—specifically, happiness—as a moral compass. The thinner or less visible the outline, the more it indicates that trust and happiness among the population have faded, along with faith in the government and the state
Based on the direction, we begin the exploration by evaluating and reviewing all the necessary data. The data can be extensive, covering variations in generosity, trust in government, and even CPI status. However, it should be connected into one coherent flow to understand how corruption in a country affects happiness — or whether happiness still exists even when a country ranks well on the corruption index.
We then continue with the sketch phase to visualize how the concept will be revealed. We decided to use a large circle with many smaller dots, symbolizing corruption spreading like a virus within the main circle, which also serves as a visual guide.
The data visualization shows an extensive range using a conservative method, specifically an X–Y graph. Based on this, we can identify countries with very low, moderate, and high levels of corruption.
We explored many design directions because we wanted this design not only to present accurate data and relationships, but also to create an emotional experience for the audience. We want users to feel something when they read and view it. The circle is not just a shape, but a message, and the guiding dots become visual elements that can be intuitively felt as part of the design guidance.
Lastly, here is the final design. We use white as the background color to create a clean look and improve readability. This design can be used in various settings—indoor, outdoor, digital, or for printed materials such as pamphlets.
In this data visualization, Afternorth represents this concept using circular forms. The emptiness within the main circle symbolizes how corruption has eaten away at the core of a country. The outline stroke surrounding the circle represents the presence of guidance—specifically, happiness—as a moral compass. The thinner or less visible the outline, the more it indicates that trust and happiness among the population have faded, along with faith in the government and the state


Source: Our World in Data & Kaggle
AD: Mohammad Aburizal K
Jakarta, Indonesia
2025
Jakarta, Indonesia
Source: Our World in Data & Kaggle
AD: Mohammad Aburizal K